mapSpainHist provides the municipal boundaries of Spain for each population census between 1900 and 2001, together with the figures of those censuses. This article shows how to get the maps, how to represent data on them and how to follow municipal changes over time.
Warning. The shape of most historical municipalities is an approximate reconstruction. The maps are useful above all to represent municipal data; use them with caution for geographic variables such as area or distances. See the methodology.
Installation and first load
remotes::install_github("pauvallprat/mapSpainHist")The available censuses are:
mhist_census_years()
#>  [1] 1900 1910 1920 1930 1940 1950 1960 1970 1981 1991 2001
The function esp_get_munic_hist() returns an
sf object with one polygon for each municipality in force
at the given census. The first time it downloads the geometries from
Zenodo (about 6.5 MB) and stores them in a local cache; afterwards it
reads them directly from disk.
m1930 <- esp_get_munic_hist(1930)
nrow(m1930)
#> [1] 9343
head(sf::st_drop_geometry(m1930))
#>   cod_ine no_munic censo        municipio        prov cod_ccaa       ccaa
#> 1   01001        0  1930 Alegría-Dulantzi Araba/Álava       16 País Vasco
#> 2   01002        0  1930          Amurrio Araba/Álava       16 País Vasco
#> 3   01003        0  1930          Aramaio Araba/Álava       16 País Vasco
#> 4   01004        0  1930       Artziniega Araba/Álava       16 País Vasco
#> 5   01006        0  1930          Armiñón Araba/Álava       16 País Vasco
#> 6   01007        0  1930       Arrastaria Araba/Álava       16 País Vasco
#>        PJ hogares pder phec pob_serie
#> 1 Vitoria     146  810  735       810
#> 2 Vitoria     354 1595 1755      1595
#> 3 Vitoria     388 1945 1822      1945
#> 4 Vitoria     287 1108 1230      1108
#> 5 Vitoria      98  446  432       446
#> 6 Vitoria     122  680  655       680
Each row has the INE code of the municipality (cod_ine),
the census figures (name, province, autonomous community, judicial
district, households and de jure and de facto population) and the
geometry. Non-municipal territories (common pastures, facerías,
etc., with codes 53xxx) have no_munic = 1 and no census
figures; they can be dropped with
include_nonmunicipal = FALSE.
A population map
We represent the de jure population of each municipality in 1930.
With moveCAN = TRUE the Canary Islands are placed next to
the Peninsula, as the mapSpain package does. In this
case it is advisable to draw the box that separates them too, with
mapSpain::esp_get_can_box().
m1930 <- esp_get_munic_hist(1930, moveCAN = TRUE)
m1930$population <- cut(
  m1930$pder, c(0, 500, 1000, 2000, 5000, 20000, Inf), right = FALSE,
  labels = c("< 500", "500-999", "1,000-1,999", "2,000-4,999", "5,000-19,999", "20,000 or more")
)

ggplot(m1930) +
  geom_sf(aes(fill = population), colour = NA) +
  scale_fill_viridis_d(option = "magma", direction = -1, na.value = "grey85") +
  geom_sf(data = mapSpain::esp_get_can_box(), colour = "grey50") +
  labs(title = "De jure population by municipality, 1930", fill = "Inhabitants") +
  theme_void()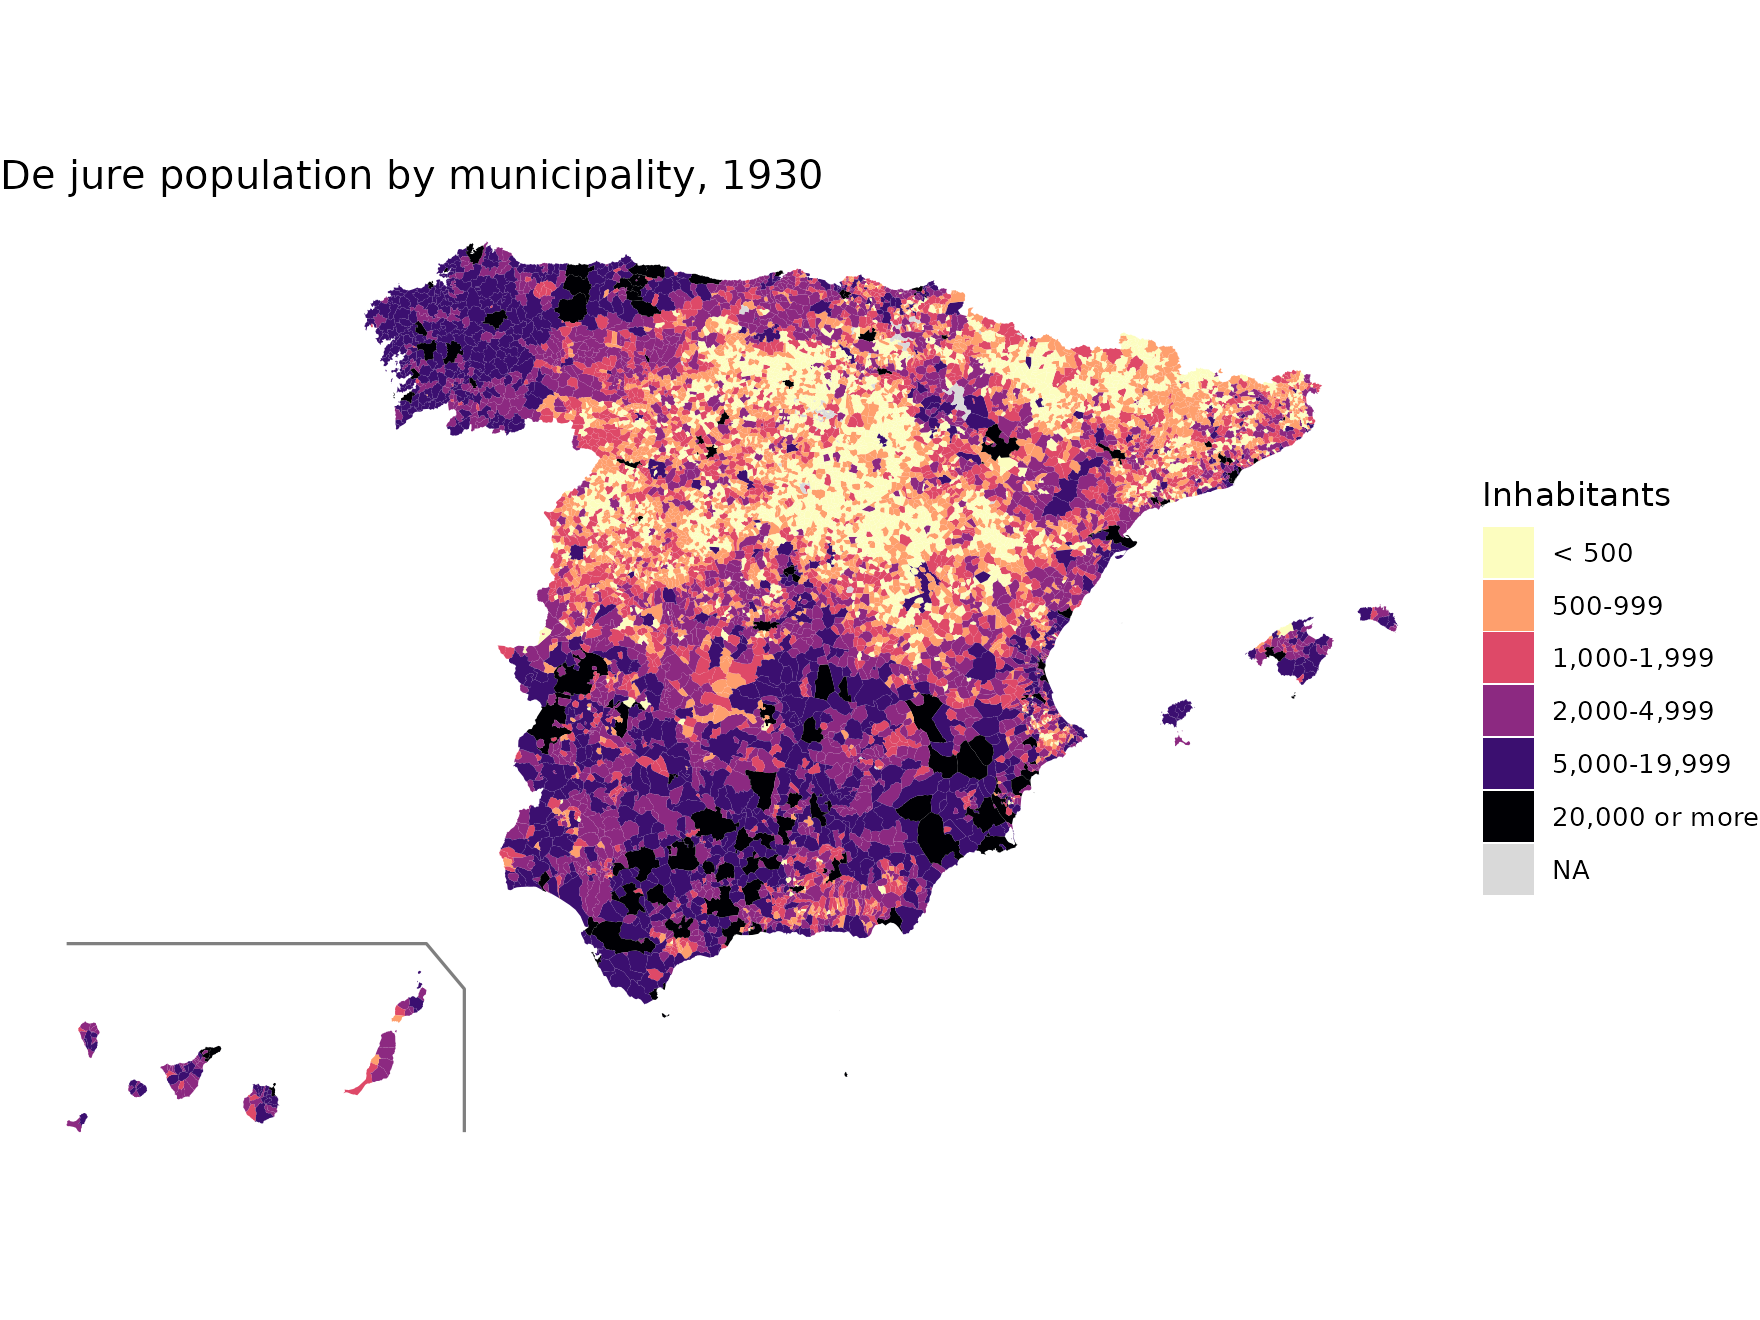
Municipalities throughout the 20th century
The censos table contains the figures of every
municipality and every census between 1842 and 2011. A municipality is
in force at a census when it has household figures
(hogares). We can count how many municipalities there were
at each census:
inforce <- censos[!is.na(censos$hogares) & censos$censo %in% mhist_census_years(), ]
table(inforce$censo)
#>
#> 1900 1910 1920 1930 1940 1950 1960 1970 1981 1991 2001
#> 9267 9262 9255 9262 9257 9214 9201 8653 8023 8076 8108
The sharp drop in the 1960s and 1970s corresponds to the municipal mergers of those years. As each map contains exactly the municipalities in force at its census, these changes can be followed on the ground. For example, Valdetórtola (Cuenca) was created in the 1970s from several municipalities and dissolved in the 1990s:
m81 <- esp_get_munic_hist(1981, epsg = 3035, census_data = FALSE)
area_vt <- sf::st_buffer(m81[m81$cod_ine == "16907", ], 12000)

maps <- lapply(c(1970, 1981, 1991), function(y) {
  m <- esp_get_munic_hist(y, epsg = 3035, census_data = FALSE)
  m <- m[lengths(sf::st_intersects(m, area_vt)) > 0, ]
  m$census <- y
  m
})
d <- do.call(rbind, maps)

ggplot(d) +
  geom_sf(aes(fill = cod_ine == "16907"), colour = "grey30", linewidth = 0.2) +
  scale_fill_manual(values = c(`FALSE` = "grey92", `TRUE` = "tomato"),
                    labels = c("Other municipalities", "Valdetórtola"), name = NULL) +
  facet_wrap(~census) +
  theme_void()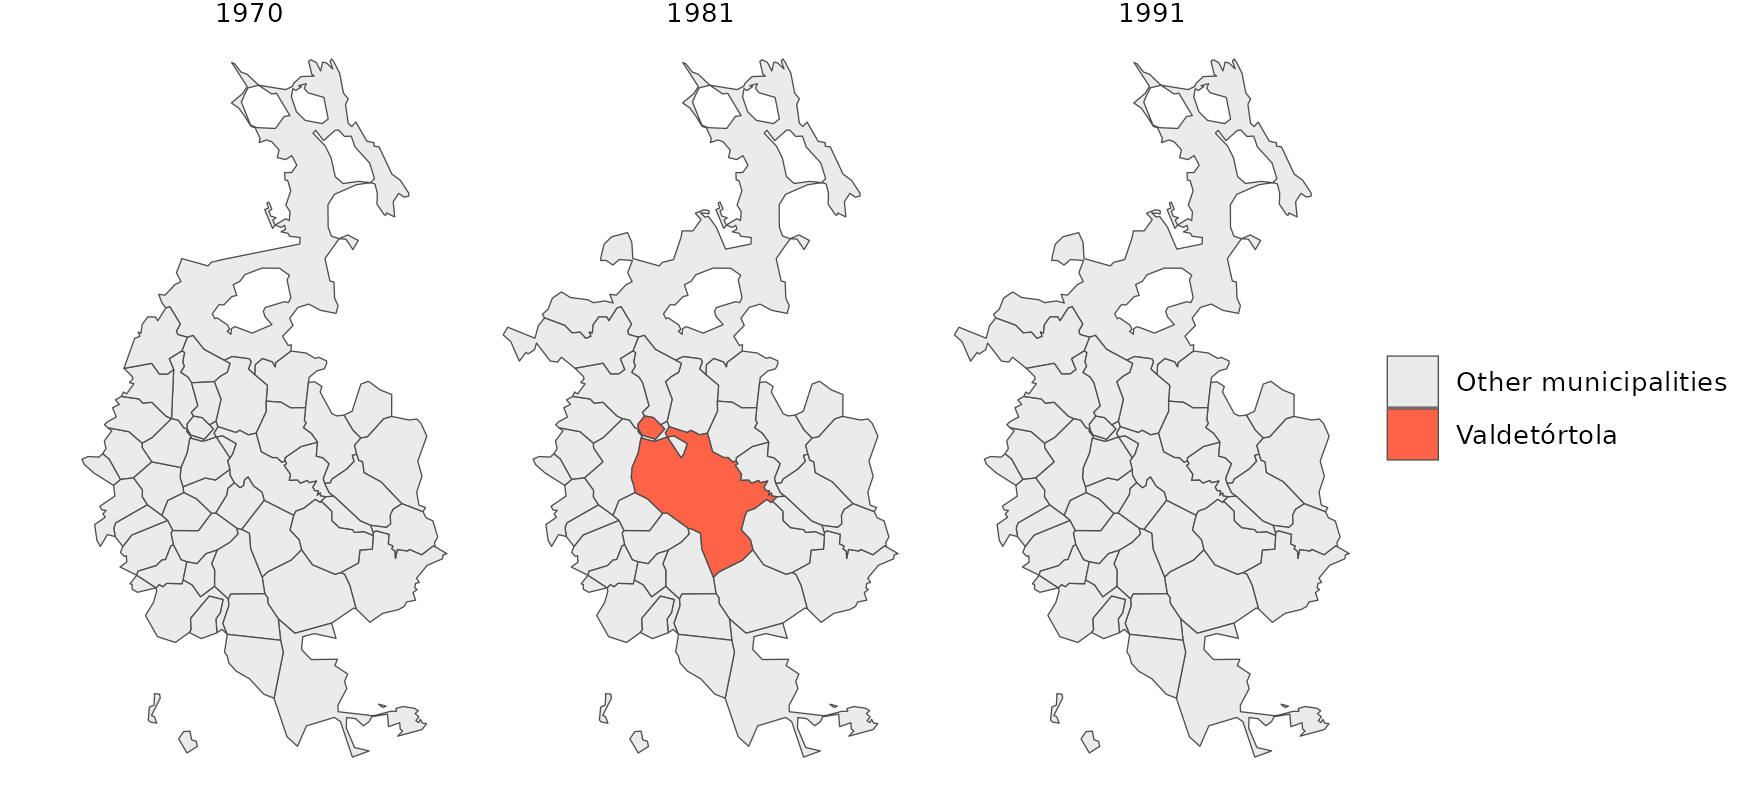
Adding your own data
To represent your own data (for example, election results or figures
from another census), just join them by the INE code,
cod_ine, a 5-character string:
mydata <- read.csv("municipal_data_1930.csv", colClasses = c(cod_ine = "character"))
m1930 <- merge(esp_get_munic_hist(1930), mydata, by = "cod_ine", all.x = TRUE)
To aggregate data to provinces, judicial districts or electoral districts, see the article Higher-level units and data aggregation.
Cache
The geometries are stored in the directory returned by
mhist_cache_dir(). It can be changed for the session with
mhist_set_cache_dir() or with the cache_dir
argument of the functions, and emptied with
mhist_clear_cache(). The argument
update_cache = TRUE forces a new download.
mhist_cache_dir()
#> [1] "/home/runner/.cache/R/mapSpainHist"